

Pearson+ Home page
Get exam ready with videos and practice problems tailored to your course
Thousands of concept videos and practice problems tailored to your course


Actually understand your toughest college courses

Learn with videos
Watch bite size video explanations that break down tricky topics


Practice problems
Prep for your exam with thousands of exam like questions and video solutions


Get experienced help
Post questions and get answers from subject matter experts
Find your Channel
We're adding new content all the time

General Chemistry

Physics

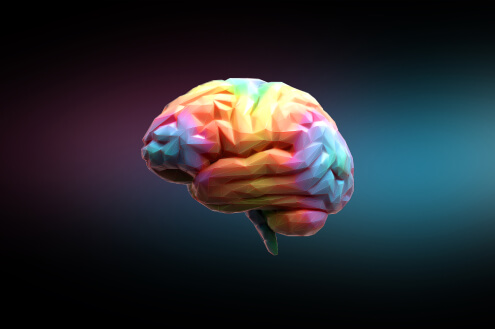
General Biology

Financial Accounting
Psychology

Microeconomics
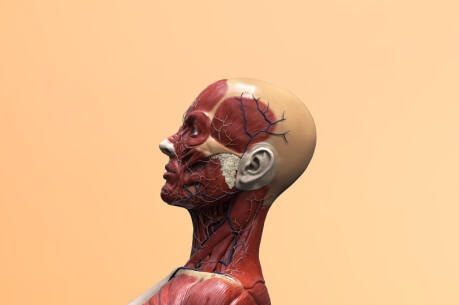
Anatomy & Physiology

College Algebra

Organic Chemistry
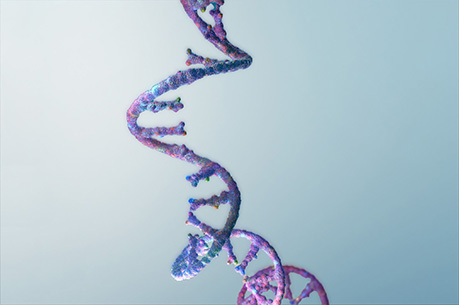
Genetics

GOB Chemistry

Intro to Chemistry
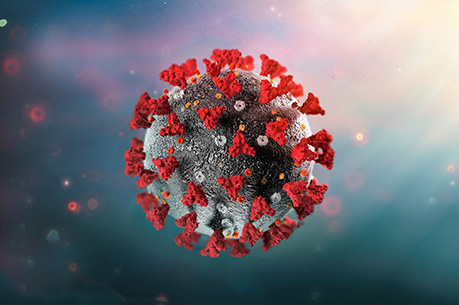
Microbiology
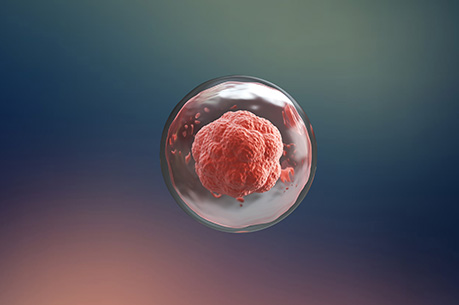
Cell Biology

Analytical Chemistry

Trigonometry
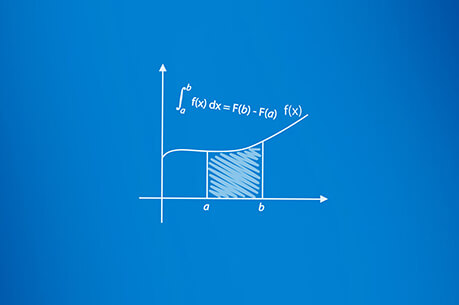
Precalculus
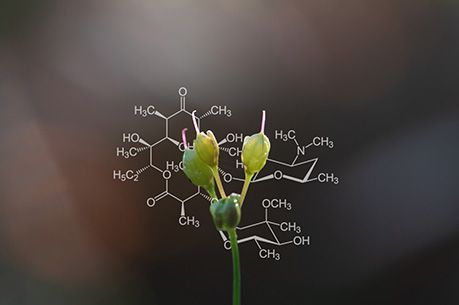
Biochemistry

Macroeconomics
Get unstuck with help from experienced tutors
Whether you're looking for a quick answer or a detailed explanation, they have it covered


- Engage in a conversation with the instructor using our comments feature.
- Use Bookmark button to reference content quickly later.
- Use "Mark as completed" button to mark some content as completed for future.
- Use "Questions" button to ask a question related to the content.


How it works
 Learn from experienced tutors
- Personalized to your course
- Bite sized videos
 Step 1Find your Channel
 Step 2Watch free video lessons
 Step 3Quiz yourself with practice questions
Students love us
The videos were very helpful in their explanations and examples and I felt that that it was the best course companion I have ever used. I truly appreciate the way it helped me study for and pass my Physics Final.
Anaïs Leroy
Hunter College of the City University of New York
It has helped me to significantly improve my grades and teaches the content in an easy to understand way. The videos have significantly improved how I study for classes like Biology, Chemistry, Physics and so many more.
Mark Sheffield
University of Pittsburgh - Main Campus
The videos have massively carried me through my UCF experience. The customized schedule based on our syllabus, the tutor availability, the videos, everything was so accessible.
Alyssa DeTommaso
UCF
I was struggling with chemistry and mathematics. The videos really broke down the various concepts and formulas in a simple and organized manner. I especially like the practice problems given.
Torinne
Texas Southern University
This allowed me to break down larger concepts for organic chemistry and really learn the material! Thank you for being a part of my organic chemistry journey!
Ross Jacobson
University of Alabama
These videos have been able to help me understand concepts in math and science in half the time it takes for my professors to teach it.
Caleb Wiedmer
Oklahoma City Community College
I was good at chem in high school but wasn’t getting it in college. I found the videos and I started to learn the why behind what was going on and it excelled my learning and grades.
Amanda Aerts
University of Colorado at Colorado Springs
This helped me excel in all of my pre-med courses and has instilled me with much confidence to complete my coursework. The video lessons that align with my textbook are interactive and helpful.
Liann
Hunter College of the City University of New York
If it wasn’t for these videos I would have struggled so much in Physics. I just happened to stumble upon this site by accident, let me tell you it was a blessing!! Thank you!!
Christina Parker
Oakland Community College
Channels is the main reason i got an A in orgo. It teaches you the main concepts and you just have to expand on them yourselves through practice and study
jide
I can see a future where classes are modeled after this type of learning experience entirely.
Paul McGovern
Palm Beach State College
During most of my General Chemistry 2 course I was struggling to keep up and understand the topics being taught to me. Then I found these videos and they completely changed my life, and grades. I went from getting C's on my first two exams to an A on the third exam and the final!
Gracie Senseman
Baylor
I really do love these videos as they helped in most classes.
Mohamed Warsame
Metropolitan Community College
Your questions answered
- Each Channel is a specialized platform full of explanations and practice problems created to help you prep for exams. Channels are built with your course in mind, so you can learn what's being covered in your class.
- Guided Channels are personalized to follow your specific class. Our tutors review hundred of textbooks and match their content to follow your specific textbook. This means you can save time studying and only learn the content that's most relevant to your class.
- Channels is an additional tool to help you with your studies. This means you can use Channels even if your course uses a non-Pearson textbook. If your course does use a Pearson textbook you can subscribe to Pearson+ to access over 1500 Textbooks.
- Whilst Channels is personalized to your specific course; it is neither sponsored nor assigned by a specific instructor or school. This means it's completely up to you whether you want to use Channels.