Fischer Projection - Video Tutorials & Practice Problems
On a tight schedule?
Get a 10 bullets summary of the topic
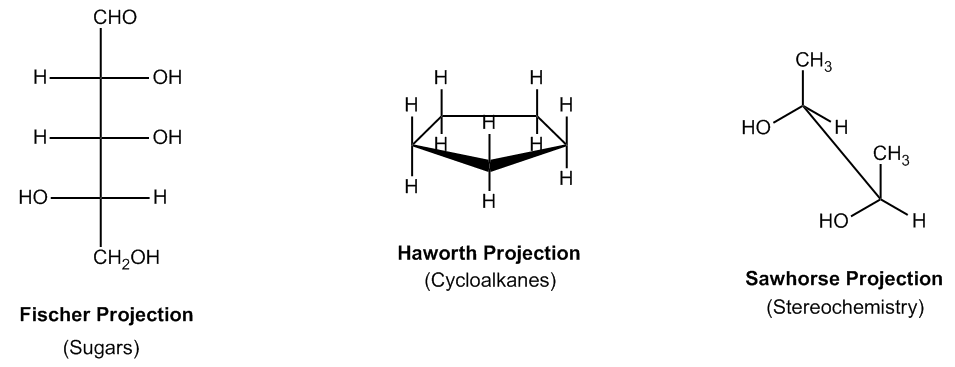
There are several common projections used to visualize molecules in different perspectives.
1
concept
Introduction to different projections.
Video duration:
1m
Play a video:
So like I said, like new projections, there's actually a lot of different types of projections. As you can see, this one right here is called a Fisher projection. It's used mostly for sugar's OK, so later on, if we gettinto sugar chemistry and carbohydrates were using Fisher projections a lot, okay, but they're also used in this chapter as well. Um, to other common ways, that air used our haul worth projection. The hall worth projection is just that three D projection of a ring, that sexual name, and it's usually used for rings. Okay, so it's used to highlight what's at the top and what's at the bottom. And then finally, we have this one called a sawhorse projection, and this one is usually used for stereo chemistry to basically say how these atoms are related to each other in terms of their orientation, their shape, their configuration. Okay, well, in all of these cases, whichever projection we're using also remember that there's Newman is Well, in all these cases, we're gonna have to convert them into bond line before analyzing them completely. Okay, What that means is that these projections they're really good for analyzing certain types of things. But if we want to compare them against other normal molecules, we're gonna have to convert them into bond line first. Because that's really like our czar metric system. That's our standardization, okay?
We will need to know how to convert these into bondline so that we can analyze them.
2
concept
How to convert Fischer projections into bondline structures
Video duration:
5m
Play a video:
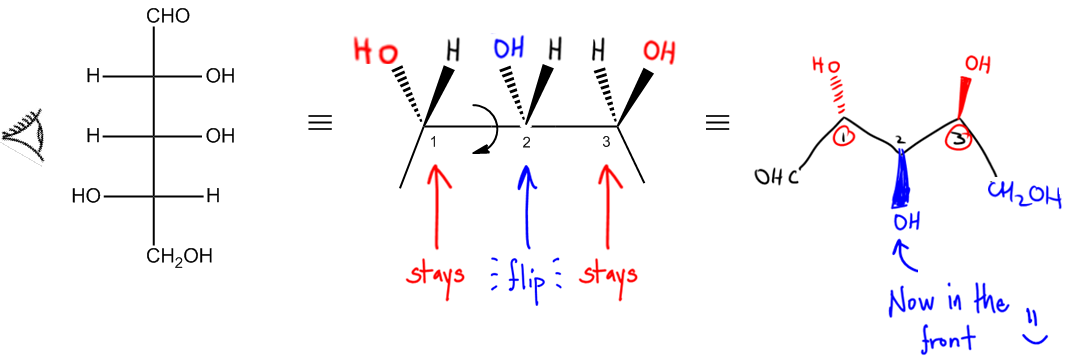
So basically you can see I have make a caterpillar, what the hell am I talking about? Well, really official projection, even though it looks two D. It's not really too deep. The way that it's really supposed to be interpreted is that every vertical bond is going into the page on a wedge. Okay, so this would be vertical and vertical. Okay, and then every horizontal bond coming off of it is a wedge. Okay, so those were dashes? I'm sorry, I might have said wedge. Those are dashes and these are supposed to be wedges. Okay, so even though it looks two D, it's really not too deep. That's just the way it's drawn to make it easier, but really the way that it's supposed to be interpreted is with wedges and dashes. Okay, so what I asked you guys to do is okay if we're gonna convert this into bond line, we need to use this wedge and dash notation first. So what I say is okay if you're given a bond line first, do what I just did and make it wedge and dash like I just did, then we're gonna use an eyeball and we're gonna pretend like we're looking at it from the side and what we're going to see is that it's going to make what I call a caterpillar, basically what that means is that this C H. O. Here would be right here, C H. O. Okay, this C H 20 H would be here, C H 20. H. And what we would notice is that we have three different junctions. 123 and these are the places where bonds come off the top. Okay, and if you think about it, maybe draw a line down here. This actually kind of looks like a caterpillar right now. This just got really goofy but it kind of looks like a caterpillar with its like its like on a leaf and it's like eating away and it's like munching away and it's got its little hair sticking up. That's why I call it a caterpillar. Alright, so basically I don't want you guys to necessarily draw the whole caterpillar. You don't need to draw a face or anything. I'm not going to be strict about that. But what you should do is realize that this bond here one relates to one right here. So what that means is that I look at the eyeball and I say okay, according to the eyeball, what should be in the front and what should be in the back, what is it? Seeing closest to itself? And what it's saying is that there should be an H in the front because that's the closest one to the eyeball and there should be an O. H. In the back because that's the furthest one from the eyeball on the one carbon. So what I'm referring to here is that I have this H here and then I have this O. H. Here, is that making sense? So I'm looking at the one carbon and saying what's in the front, what's in the back, in the same way I would work with the other ones. Then I'd say two should have an H. In the front and an O. H. In the back and then three should have an O. H. In the front and an H. In the back. Is that making sense so far? Once I have my caterpillar then I have to do my last step and that's going to give me my bond line. So we're actually really close to the bond line. The thing is that bond line structures, are they ever like that where all the bonds are in a straight line? Usually not usually there's a zigzag pattern right? So we need to restore this back to a zigzag pattern. How do we do that by rotating every other bond? Okay and another thing I like to say is that by rotating every even bond? Okay so what we're gonna do here is I'm gonna show you guys how to do this. Basically. What we would do is we have one and two. And what we do is we rotate every other bond. So we would rotate to is my atom I'm gonna want to to face down. Okay and if we rotate to to face down that's gonna restore my zigzag. So now what I'm gonna do is I'm gonna draw this like this where I have one is here, two is here, three is here and then it goes down like this. So then the C. H. O. Is in the same exact place. The C. H. 20. H. Is in the same exact place. Okay in fact one in three are in the same exact place. Notice that they were both pointing up before one in three were both pointing up. So that means that the groups that are on one in three should look exactly the same. That means that one should have an O. H. At the back and it means that three should have an O. H. At the front. Do I have to draw the H. Is No because this is bond line. Remember in bond line Hs are omitted. Ok so so far so good. In fact so far this is exactly the same molecule. Okay the only thing that's changed is that now I'm rotating to down. That means that whatever I had on to has to flip. That means that where should the H. Go should it go on the back the front? Where should it go? Since it's rotating the O. H. Should now go on the front. Okay because of the fact that it rotated down, that means that that bond that was in the back is now going to rotate to the front. So now what I've just done is I've just made my bond line that is a bond line structure right there. Okay and all I did was I rotated every other bond. So meaning that I rotated this one this one doesn't get rotated, see like this one is fine, that one doesn't get rotated. But then this one got rotated and then this one didn't. Okay. So I noticed that every other one I rotate. And if this is a longer chain then I would also rotated adam four to go down. So I would have rotated adam to adam four adam six until my Fischer projection is done. All right. And that would make the zigzag pattern. All right. So what I want you guys to do is just as free response, convert the following fisher projection into a bond line structure. Go ahead and try to solve it yourself and then I'll go ahead and step in and show you guys how to
Make a caterpillar, then rotate every other bond.
Convert the following Fischer projection into bondline structure.
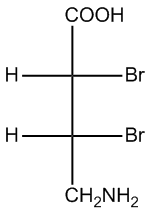
3
concept
Convert the following Fischer projection into bondline structure.
Video duration:
3m
Play a video:
all right guys, let's go ahead and go step by step. The first step would be to re draw this with the wedge in the dash, so I would put this on a dash, I'll put this on a dash, I would put these guys on wedges, B R B R H H. Is that cool so far? Now, what I want to do is I'm gonna draw my eyeball because that's gonna help me remember what things look like. Okay, notice that I have carbon one here, Carbon to here. These are the back of the caterpillar, so now when I convert this into a caterpillar, what it's gonna look like is like this, where I have adam one adam too, that's the back of the caterpillar, What it's gonna have here is C. 00 H. What it's gonna have on over here is ch two, NH two, Now I just have to figure out what's on the top, what's on the hairs. Okay, so it should actually be really simple, I should just have for my wedges, I should have H and H. Because those are the ones that are closest to the eyeball for the back, what I should have is br br is that making sense so far? Cool. Now, I think a question that some of you guys might have, is that notice that before? Up here, I was drawing the H is on the right side and the front the wedge on the right and the dash on the left and then here I was drawing the wedge on the left and the dash on the right, it does not matter, you can draw them however you want, as long as the thing that's in the front is still in the front the things that's in the back is still in the back. All right so now we have our caterpillar so now how do we convert this into bond land? All I do is I rotate every other bond or what I want to make sure every other atom is face down, every even atom is face down so that means it's gonna be adam to. Okay so Adam two is gonna be the one that has to face down. Okay so let's go ahead and convert this. What that means is that now this is gonna turn into this, this and that where this is now Adam one, this is Adam too. Okay so now I'm gonna actually subtract myself from here, take myself out so that I don't get in the way. So now what should be coming off of one? What should be coming off of one is the same thing as before, I should have the H in the front but I don't have to draw Hs. So I'm just gonna draw the B. R. In the back, is that cool? So what should be coming off of the one that's on the left of one? The one right here what should be coming off of there? Well what I should have there is just the C. O. H. Just like before Okay cool, what should be coming off of the carbon over here? This should be the CH two and to Okay, so then finally, what should be going right over where my head should be? What should be at the too well, because of the fact that two had to switch down, that means that the B. R. Has to switch its location. So that means that my br should actually face towards the front and there you go, that is my bond line structure. Okay, so basically this is how you make a bond line structure from academy from official projection notice that you can't just do it in one step, you have to do multiple steps to get here, but if you're consistent, I think you guys will be able to do this just fine.
Do you want more practice?
We have more practice problems on Fischer Projection