Graphing Costs - Video Tutorials & Practice Problems
On a tight schedule?
Get a 10 bullets summary of the topic
One of the most important graphs in microeconomics!
1
concept
Graphing Cost Curves
Video duration:
10m
Play a video:
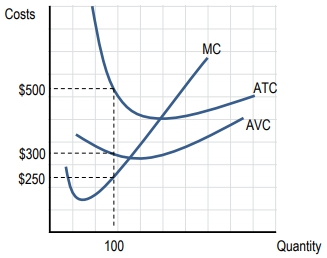
Alright. So now let's take all the information. We've learned about marginal cost, average fixed costs, average variable cost, and average total cost. And let's put it all on the graph, let's see what it looks like. All right. So, here I have drawn for you one of the most important graphs in mike economic. So, this here, Voila, I've just shown it to you. This is one of our most important graphs. And it's showing us the four cost curves that we've been focusing on. It's showing us the marginal cost. It's showing us average fixed average variable and average total. Right? So, we've got four curves there and I'm gonna go ahead and I'm gonna help you with one. Right? We've talked about marginal cost already and we've seen the curve previously when we when we talked about marginal cost. Right? So, this curve right here, the black one, that's our marginal cost curve. Okay, so, knowing that I want you guys to try and think these other three curves which ones average fixed costs. Which one's average variable cost and which ones average total cost. Okay, as a hint, I think you should try and pick out the average fixed cost curve first. Okay. So, remember when we were talking about the shapes of the curves, the average fixed cost had a different shape. Right. Because it was always decreasing. Right? The more quantity we produced average fixed cost kept decreasing, Right? Because the fixed cost stay constant. But we're splitting it up by more and more units. So which of these graphs has that shape? At least it has a different shape. Right. The only one that has a different shape and it's the one that's constantly decreasing its here. It's this blue one, right? This is gonna be our average fixed cost curve right here, and that one is constantly decreasing. Right? It has the shape we're expecting, where it falls as the quantity increases. Now. How about the other curves? The red curve and the yellow curve there? Those are the other two. Right, That's gonna be our average variable cost and our average total cost. So, I want you guys to take a stab. Which one do you think is gonna be average variable and average total? So, as a hint, I want you to think about which one is gonna be bigger. Right. Which one do you think would be bigger? Do you think average variable costs are gonna be bigger or average total costs are gonna be bigger? Because you can see that there's one graph, one line here, that's always above the other. So what do you think that means? Well, that means that the one above is our average total cost. Right? Average variable costs could never be bigger than our average total costs because there's always gonna be some fixed costs there as well. Right. So our total costs include fixed costs and variable costs. So the average total cost has to be the top curve. Right? It's gonna be always above. Uh the the other two average cost curves. So this one has to be our average variable cost and average total cost is the yellow one. Cool. So there's some intuition on just how to pick out which curve is which and when I started I told you which was the marginal cost curve. Right? I told you. And then I had you pick out the average ones. But what if I hadn't told you? How could you pick that one out? Well, remember when we talked about marginal cost, the marginal cost eventually gets steep very fast. Right? And that's the one that gets the steepest. So notice how the marginal cost curve, how steep it got there at the end when the quantity got pretty big. Um The marginal cost just started zooming up. So that's how you'll see the marginal cost curve, how you'll be able to identify it there. Right. So what I've done is I took all the information from all of our pizza examples. Right? We've been talking about this pizza and adding workers to the to the factory. How many pizzas can we produce? Right. So, we've been calculating all these different costs and that's what you see on the graph here. Okay. Um So what we're gonna do is we're gonna go down below, I've got some key facts that we want to point out about this graph. So let's start here with the shapes of the curve shape of the curves. Right? And we've talked about this a little already and we've noticed that the marginal cost curve, average variable cost and average total cost curve, they're all U. Shaped, right. So those are the ones that were gonna fall and then rise. And I'm gonna write that here, fall then rise. Right? So that was the shape of those three curves and then the A. F. C. That's the one that has a different shape. Right? This one is easy to pick out because of the different shape and that's the one that just gets smaller and smaller as the output increases. Right? And that's what we saw above. It's got that different shape where it's just deep this way decreasing and decreasing and decreasing and decreasing right as the quantity goes up. Cool. So that's gonna be the shapes of the curves. Next I want to talk about the relationship between a T C, A B C. And a F. C. Okay, so remember that we had this uh definition for average total cost right? Where average total cost equals average fixed cost plus average variable cost. Well we can rearrange this equation any number of ways. Um Just doing a little algebra, right? We can move terms to the other side and find out what average fixed costs equals. So it could be something like this, average total cost minus average variable cost equals average fixed cost. Right? And that comes from just subtracting average variable costs from both sides. Right. And that gets us to this new equation. Um So what does that mean? What does that tell us on the graph? Well, an important relationship that you want to see between our three average curves. So forget about the marginal cost curve right now. Just the three average cost curves A F C A B C and A T C. That there's gonna be this space always between the A. T. C. And the A. V. C. Here. I'm gonna do it in green. So this space in between the average total cost and the average variable cost. Remember that our average total cost is always gonna equal average fixed cost plus average variable cost. So this amount here that I'm highlighting that's the amount of average variable costs. Right? That means that that little gap that I'm showing right here between the two. That's gonna be equal to the average fixed cost. Okay. And that's because the total amount from from zero up to the average total cost curve contains both the average variable cost and average fixed cost. All right. So, you could easily get a question where they don't give average fixed cost curve but you can figure out what the fixed costs are because of the difference between these two curves. Right? So that average fixed cost. You can always figure it out from the difference between a T. C. And a VC. Right? That's gonna be how we figure out average fixed cost sometimes. Alright. So that's that relationship between those three and one more thing about these curves is that the distance between A. T. C. And a B. C gets smaller and smaller as we increase output. And this should make sense because remember that the average total cost is both average fixed and average variable. Right? It's the sum. But remember that that average fixed cost keeps getting smaller and smaller and smaller as we get to higher quantities. So what would you imagine is that most of our total costs are gonna be variable costs as we get to big quantities? Right. Because that those average fixed costs are gonna keep getting smaller per unit where the rest of the cost has to be made up by variable cost. So that's what you see happening at first. There's this big gap between average variable cost and average total cost and it keeps getting smaller and smaller and smaller and smaller. Right? So it just keeps getting smaller as the quantity goes up. Right? And that's because the fixed costs keep taking up a smaller and smaller portion of that total cost. Cool. Alright. So the last thing we want to talk about is the relationship between marginal cost and average cost. So we've talked about this a little bit right how the marginal cost drives the average cost curves right? If marginal cost is below um the average total cost it's going to drive that average total cost down. Right? Or if the marginal cost is above average total cost it'll drive it up. The marginal cost. What side of the averages on tells us which way the average will move. So you can imagine the cost the marginal cost curve where it is is going to also affect um these curves. So what we're gonna see is that that marginal cost curve is gonna cross go back to read is going across both the A. T. C. And A. V. C. The total cost and the variable cost, it's gonna cross them at their minimum values. Okay? So when they're the smallest, that's when it's gonna cross and that's what we're gonna see up here on our graph. Right? So right here we've got our marginal cost curve in black and I'm gonna go ahead and and use blue right now um notice that when the marginal cost curve crosses the average variable cost right here in the blue dot it's where the average variable cost is the smallest. Right? And that makes sense right? Because before it crossed it, when it was below it it was bringing the variable cost down bringing the variable costs down the average variable cost and then it's gonna touch it and then it's gonna be bigger. Right? So then after it touches the marginal cost starts bringing the average variable cost back up. And that goes back to that idea right where the marginal cost is driving, which way the variable average variable cost. An average total cost move. So we see the same thing here with average total cost. It's crossing it here at its minimum point, right? So that's the minimum point of the average total cost curve. And then once the marginal cost gets bigger than the average total cost, it starts driving it up. Right? So that's that relationship between average and marginal that we've been seeing. Cool. And just like we've been saying uh that's the same point, right? When marginal cost is below, that's uh that's when we're gonna see the A. T. C. And A. B. C. Falling, right? So when marginal cost is below the A. T. C. And A. B. C. You're gonna see that they're sloping down and then it's gonna touch it at the minimum and then it's gonna be marginal cost will be bigger. So it's gonna start rising again after, right? So when the marginal cost gets above 80 C. Or A B. C. They start rising there. Cool. Alright, so that graph is really important. I suggest, hey, why don't you just restart the video and now that you kind of have all this information, maybe you watch this one again and see how it all fits. Um Now that you know what you're looking for. Cool. Let's go ahead and either watch it again or move on to the next one. Alright let's do that. Now
2
Problem
Problem
If average total cost is $50, quantity produced is 10 and total fixed cost $100, what is the total variable cost for the output of 10?
A
500
B
100
C
400
D
1000
3
Problem
Problem
Based on the graph below, at a quantity of 100, AFC is equal to:
A
$50
B
$200
C
$250
D
Need more information
4
Problem
Problem
When a firm is producing zero output, total cost equals: